Getting Started with Analytics
The Analytics module in Schedule Xpress gives you access to dashboards and charts that display key scheduling data. It allows you to review trends, monitor performance, and support decision-making.
This section shows you where to find Analytics and how to navigate between dashboards to view different data sets.
Access Analytics
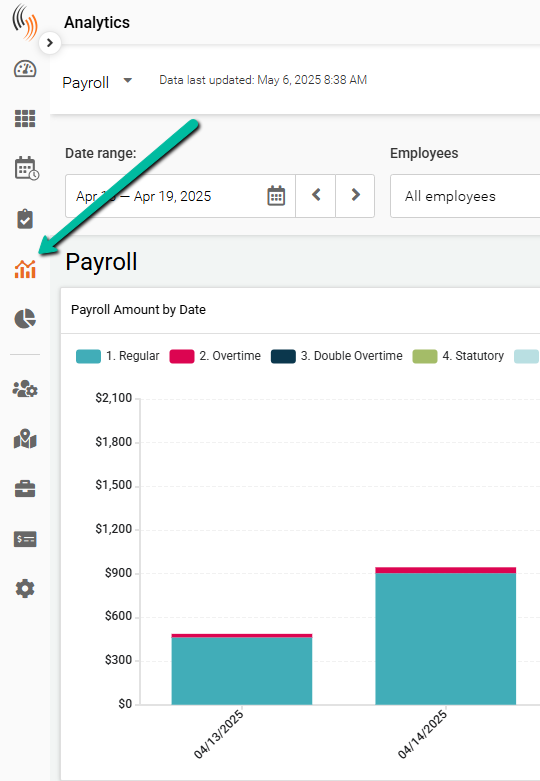
The Analytics module appears as a chart icon on the left command strip.
The icon resembles a bar and line chart and is located on the left side of the command strip.
Dashboards
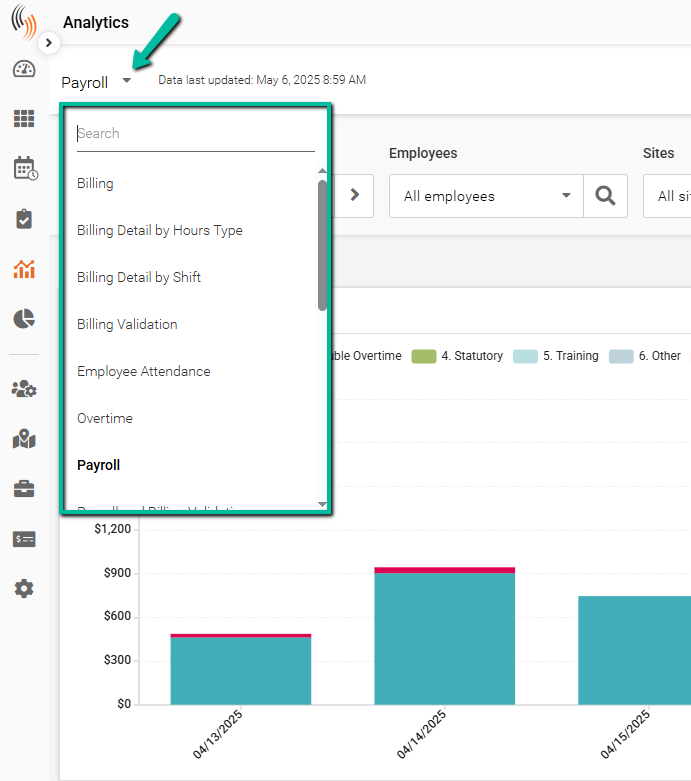
Use the dropdown menu in the top-left corner to switch between dashboards.
The platform includes 18 dashboards organized into the following areas:
Financial Dashboards
- Billing
- Billing Detail by Hours Type
- Billing Detail by Shift
- Billing Validation
Workforce Management
- Employee Attendance
- Overtime and Training
- Time and Attendance
- Time and Attendance Detail
Payroll and Compliance
- Payroll
- Payroll and Billing Validation
- Payroll Detail by Hours Type
- Payroll Detail by Shift
- Payroll Validation
Performance Analysis
- Profitability
- Profitability Detail by Hours Type
- Profitability Detail by Shift
Operations
- Scheduling
- Scheduling Detail by Shift
- Shift Assignment
Each dashboard contains a range of charts that display different types of data. All charts can be exported.
Use the dashboard dropdown to navigate between dashboards and view different data sets.